Sample Report
The following is an authentic AIAnalyst generated report made available as a sample.
Strategy Report
Specialized Formula Trading Information
Strategy Parameters
str.516ce493864a1
Date
2013-04-16 03:13:33
Symbol
IBM
BacktestPeriod
12 months
Input
5 candles
Allowed Complexity
Low
Forecast Result | UP |
| Forecast Result Date | 2013-04-17 |
| Number of Trades | 245 |
| Number of Trading Days | 245 |
| Positive Trades Count | 146 |
| Negative Trades Count | 98 |
| Long Trades Count | 188 |
| Short Trades Count | 57 |
| Trade To Candle Ratio | 100.00% |
| Positive Trades Ratio | 59.59% |
| Negative Trades Ratio | 40.00% |
| Positive Trades Total | 177.4600 |
| Negative Trades Total | -98.1800 |
| Net Total | 79.2800 |
| Return of Investiment (ROI) During Period | 39.87% |
| Average Net Daily Return Value Per Share | 0.3236 |
| Average Daily Instrument Value | 198.8427 |
| Formula Performance Graph Over Period | 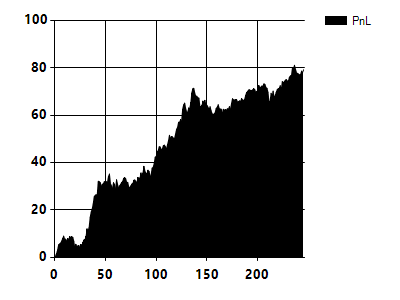 |
Specialized Formula
| Formula - Help | (IF low3 > low5 THEN (open1 - open2) ELSE close3) |
| Excel Formula - Help | =CHOOSE(SIGN(IF(D4 > D6,(B2 - B3),E4))+2,"DOWN","N\A","UP") |
| C Code - Help | typedef struct |